This post is for those participants of #EL30 who like to play with graphs or/and with gRSShopper.
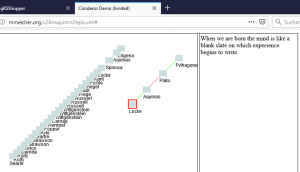
 Without modifying my own tool yet, I was able to generate interactive maps like this http://mmelcher.org/x28map.html?epis.xml directly out of gRSShopper: with just two new tables, two new views and two pages.
The two tables can be obtained from here, in the .sql format that can be imported into cPanel > phpMyAdmin (a more detailed description was here).
The first of the pages, x28map.html, is used for all such maps; it just fetches the Javascript:
<!DOCTYPE html>
<body onLoad="main()">
<s cript src="h ttp://x28hd.de/demo/x28map.js"></s cript>
</body>
The content page loaded from there, epis.xml, is mainly in XML syntax (shown in blue) and looks like this:
<?xml version="1.0" encoding="UTF-8"?>
<x28map>
<keyword db=x28node;format=condensr;>
<keyword db=x28edge;format=condensr;>
</x28map>
where the green <keyword> construct is gRSShopper syntax and will be replaced by contents of the two tables (nodes and edges), formatted with the following two views:
<topic
ID="[*x28node_id*]"
x="-[*x28node_id*]0"
y="[*x28node_id*]0"
color="#ccdddd">
<label>[*x28node_title*]</label>
<detail><![CDATA[ [*x28node_detail*]]]></detail>
</topic>
‘Topic’ is just another term for the node, which has an x and y coordinate on the map, a label, a detail field, a color, and an ID. The ID is also abused as a very initial value for the coordinates (they get 10 pixels apart by simply appending a ‘0’). The green [*x28table_column*] variables will be filled from the respective columns.
<assoc
n1="[*x28edge_idone*]"
n2="[*x28edge_idtwo*]"
color="[*x28edge_color*]">
<details/>
</assoc>
‘Assoc’iation is another term for the edge, which has two end nodes n1 and n2 (just like the original ‘graph’ table shipped with gRSShopper, has an ID ‘one’ and an ID ‘two’), plus a color, and here no details.
(If you like the demo data, here is more.)

